Crypto PnL tracker

Crypto trading journal for professional traders

Connect exchanges, analyse every trade, stress-test strategies, surface your recurring mistakes. Free plan forever — sign up with email or Google.

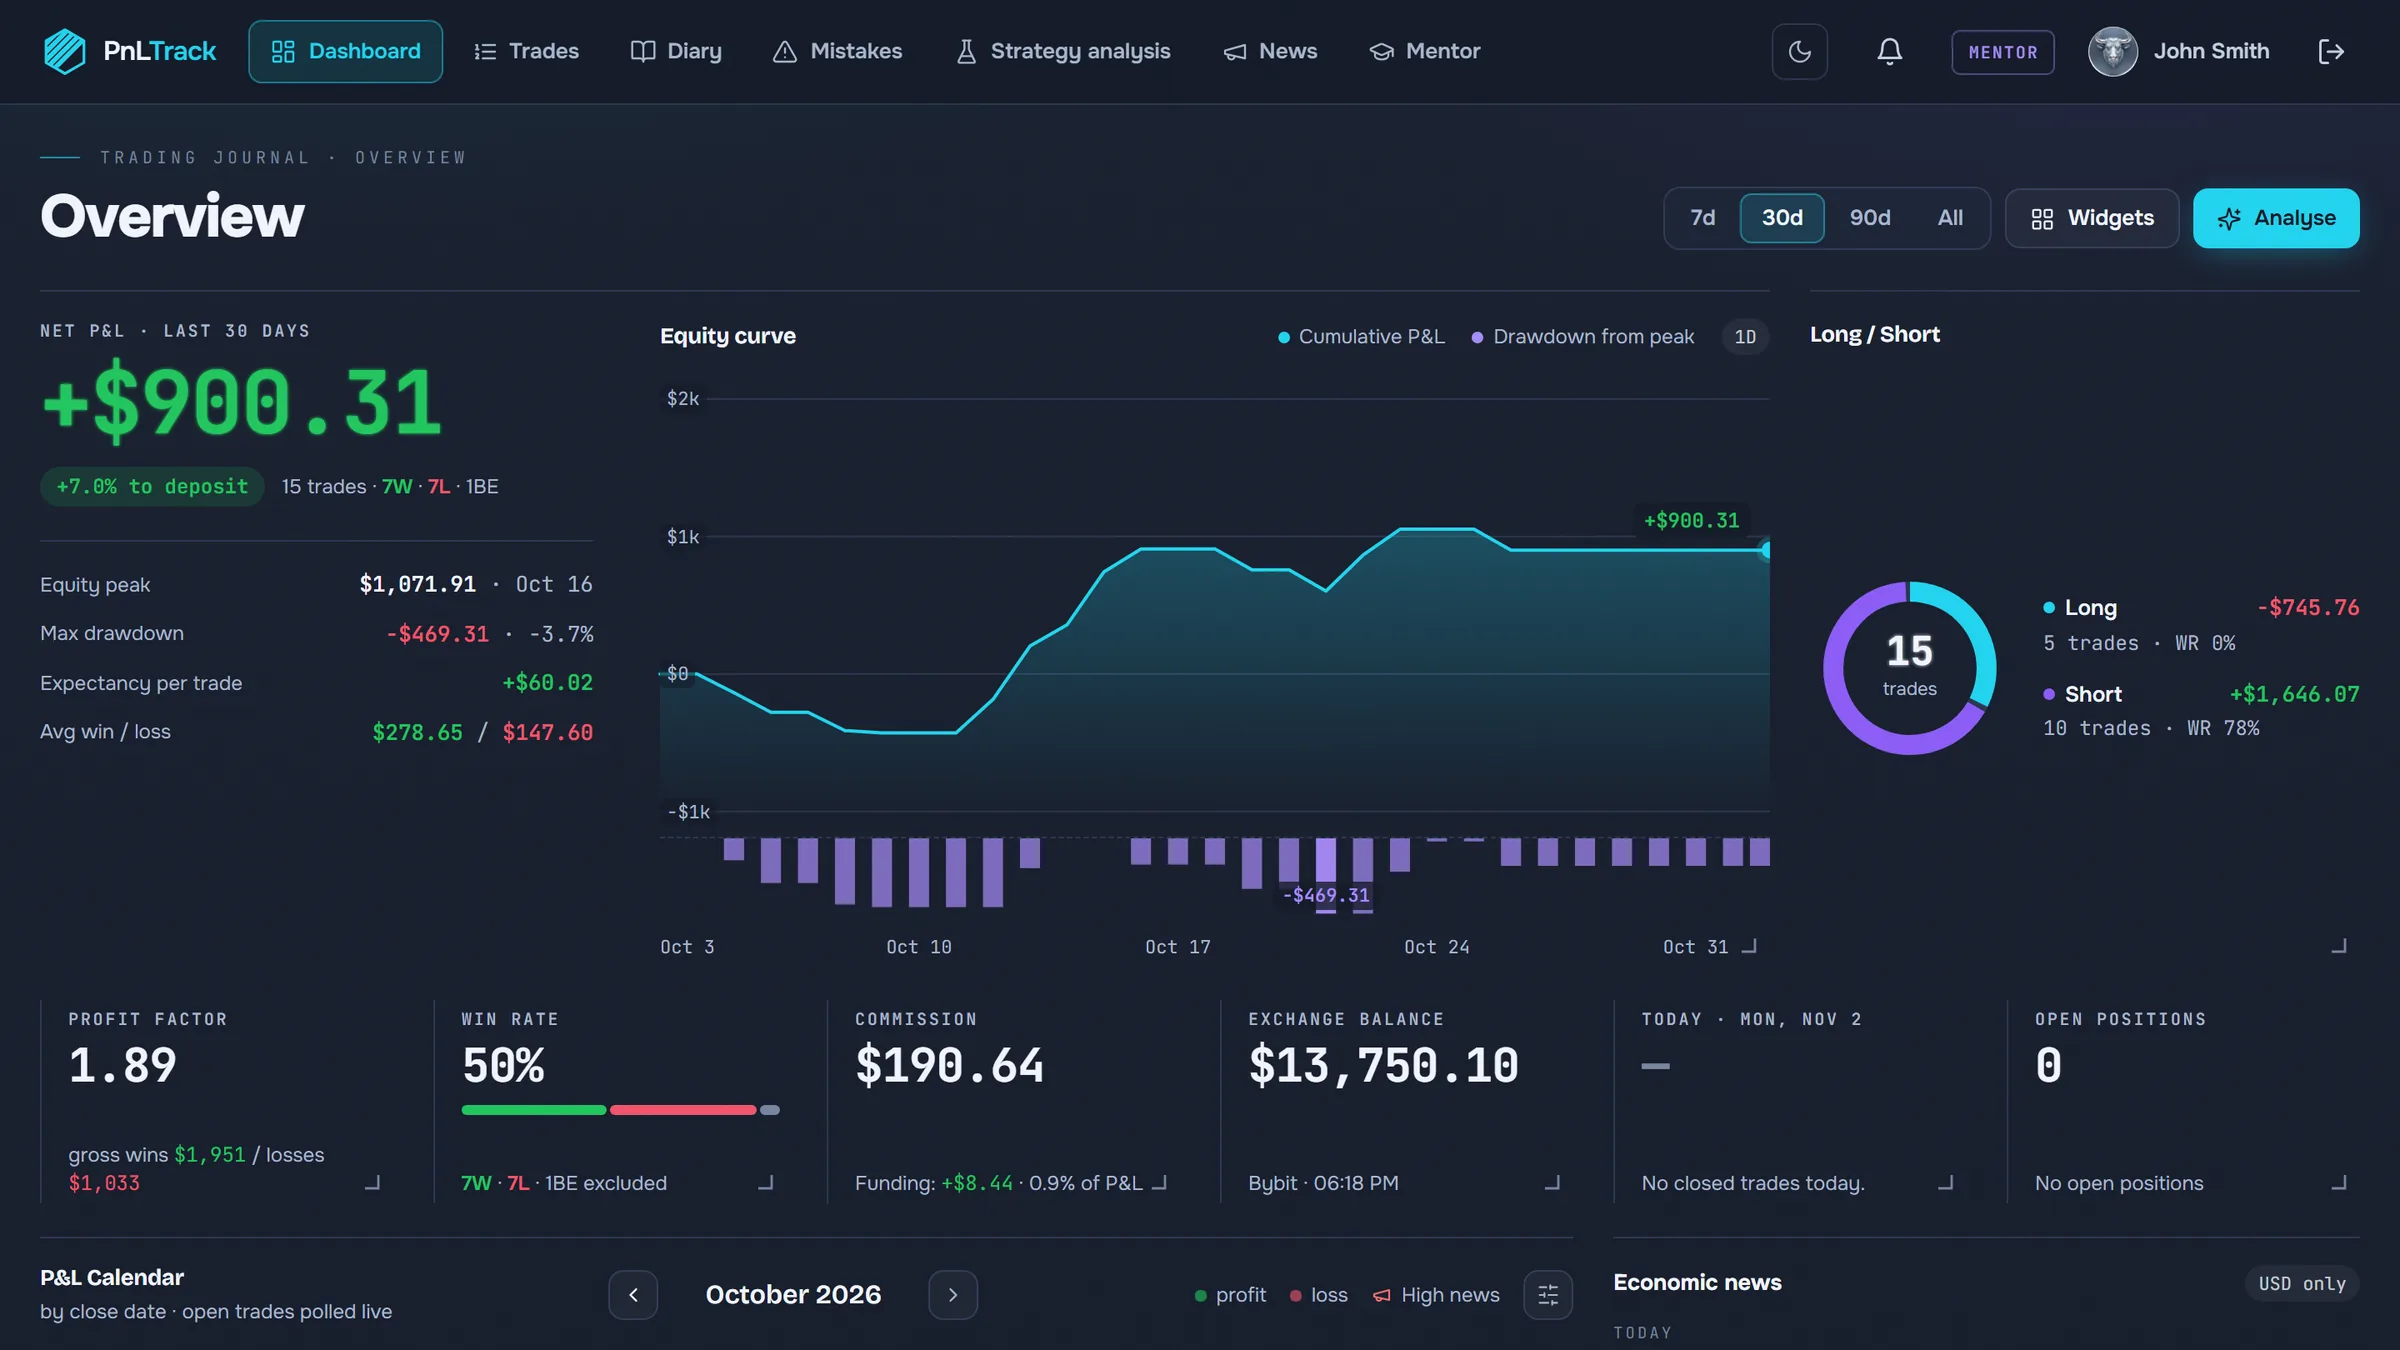
PnLTrack dashboard: net P&L with an equity curve, win rate, profit factor, long/short split and the P&L calendar of a demo account
Supported exchanges
BINANCE
BYBIT
OKX
MEXC
WHITEBIT
BINGX
BITUNIX
BLOFIN
HYPERLIQUID
PROPR
Features

Everything you need to trade systematically

Automatic trade sync

Connect Binance, Bybit, OKX, MEXC, WhiteBIT, BingX, Hyperliquid or Propr with read-only API keys — trades sync automatically, no manual entry.

Diary & trading plans

Notes on every trade, entry and exit reasons, plans made in advance and their outcome.

Strategy analysis

Keep a strategy journal: test setups on history and compare them against your live trading.

Statistics

Win rate, R:R, breakdowns by ticker, session and strategy — your systemic mistakes become visible.

Habit tracking

Track trading habits and discipline right next to your results.

Mentorship & sharing

Share trades via a public link, or connect a mentor — they see relative metrics without monetary amounts.

Inside the journal

A trading journal that does the bookkeeping for you

PnLTrack is a crypto trading journal with automatic trade sync: the exchange delivers the trades, you add the plan, the stop and the reasons, and the journal turns it into statistics, R-multiples and a list of your most expensive mistakes.

How it works
  1. 01

    Connect an exchange

    Add a read-only API key for Binance, Bybit, OKX or another supported exchange. The key cannot trade or withdraw.

  2. 02

    Trades sync themselves

    Fills are matched into positions about once a minute: entry, exit, fees, funding and hold time — no manual entry.

  3. 03

    Review in R, not in dollars

    Set a stop in the plan or on the trade and every result is measured in R-multiples, so trades of any size compare.

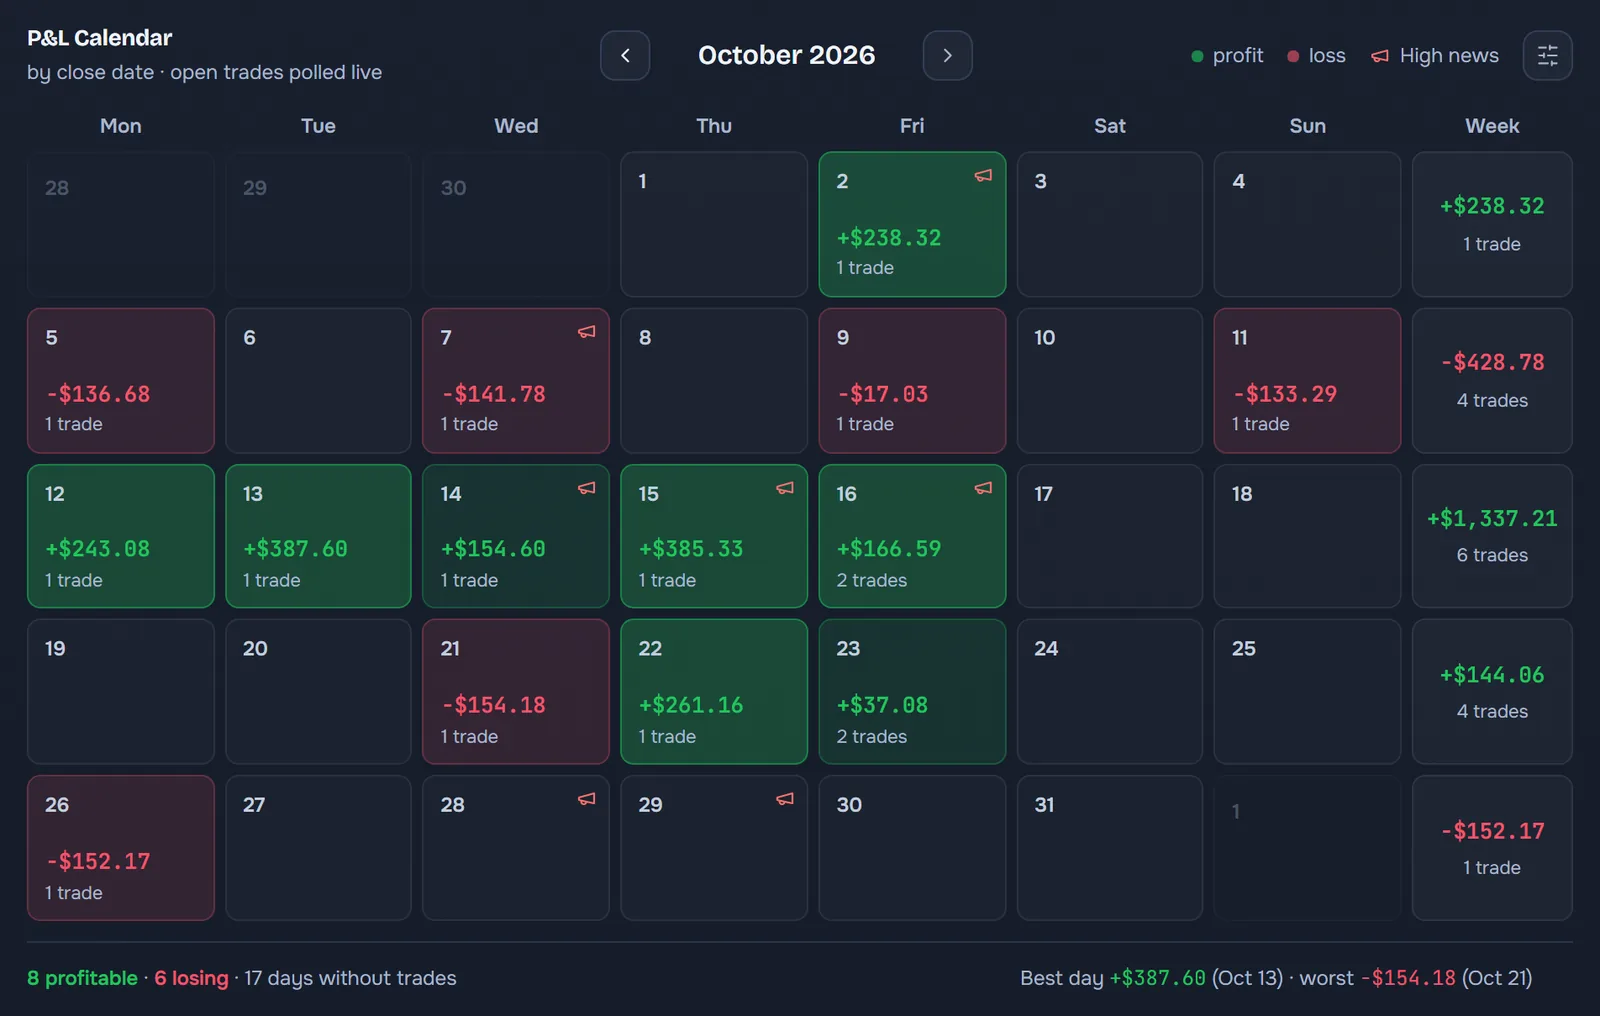
P&L calendar for October: every trading day coloured by result, weekly totals, the count of profitable and losing days, the best and the worst day

P&L calendar and statistics

The dashboard turns the trade list into numbers you can act on: net P&L and equity curve for 7, 30 or 90 days, win rate, profit factor, long/short split, average win and loss, results by weekday and a calendar that colours every trading day.

  • Daily and weekly P&L at a glance
  • Profit factor, win rate, average hold time
  • Economic calendar next to your results
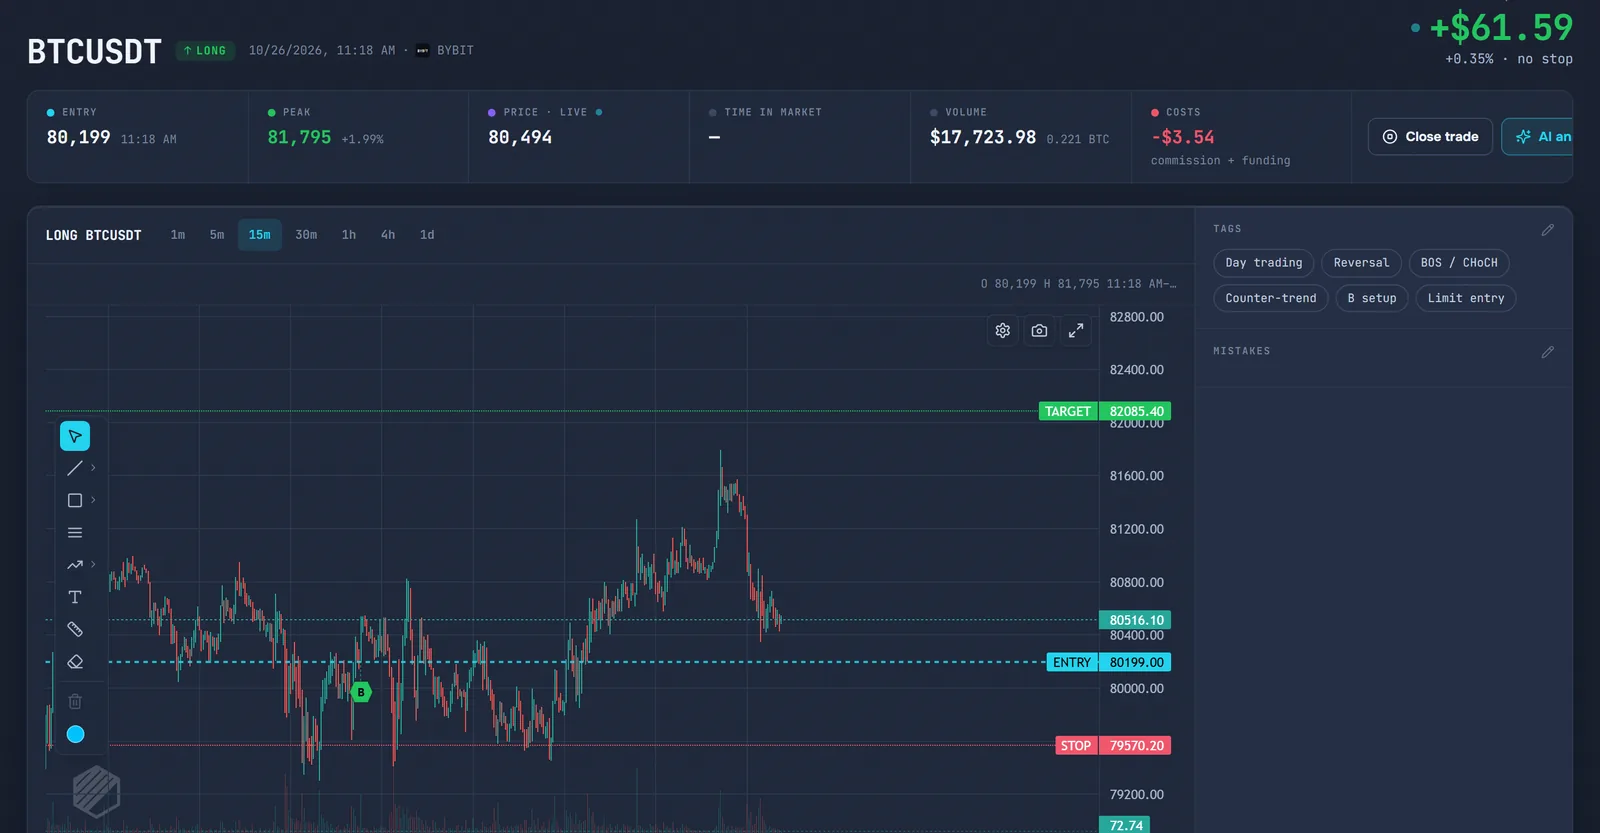
Trade page: a BTCUSDT long on a 15-minute chart with entry, stop and target lines, live P&L and tags

Every trade on its chart

Open a trade and see it where it happened: candles from the exchange with the entry, stop and target drawn on them, live price for open positions, fees and funding, tags and mistakes.

  • Entry, stop and target on the candles
  • R-multiple from the stop you planned
  • Tags for setup, session and mistakes
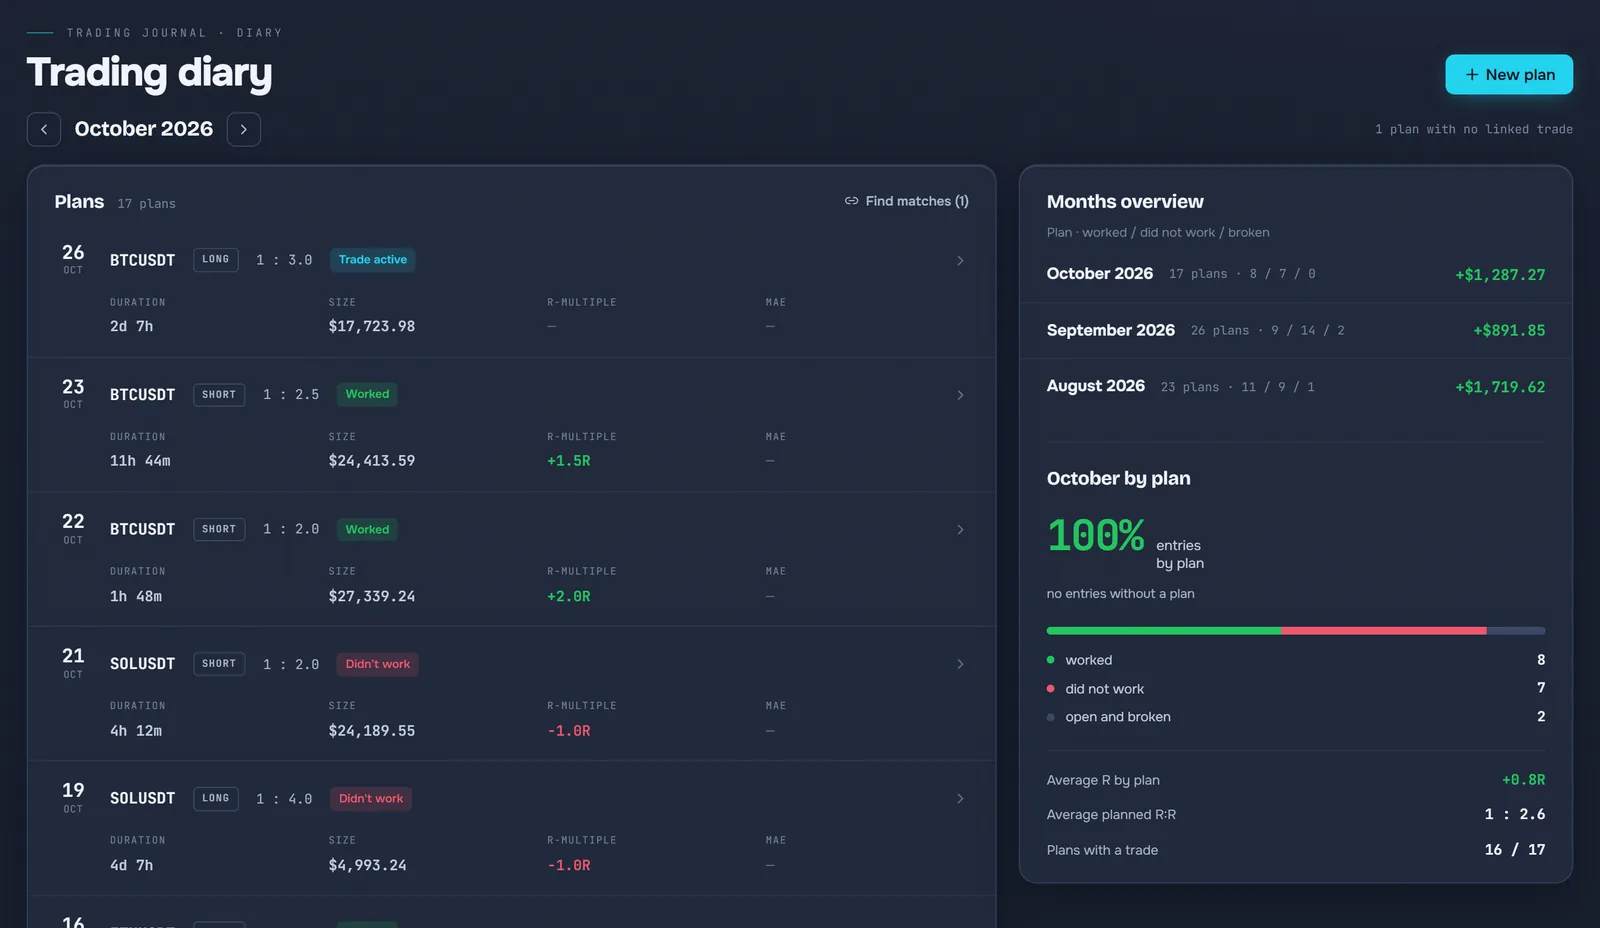
Trading diary: a list of October plans with planned risk/reward, result in R and a monthly overview of plans that worked

Trading diary and plans

Write the plan before the entry: side, entry, stop, target and the idea. When the trade comes in, the journal links it to the plan and shows what worked, what did not and how many entries were taken without a plan.

  • Risk/reward planned before the entry
  • Worked / did not work / broken — per month
  • Share of entries taken by plan
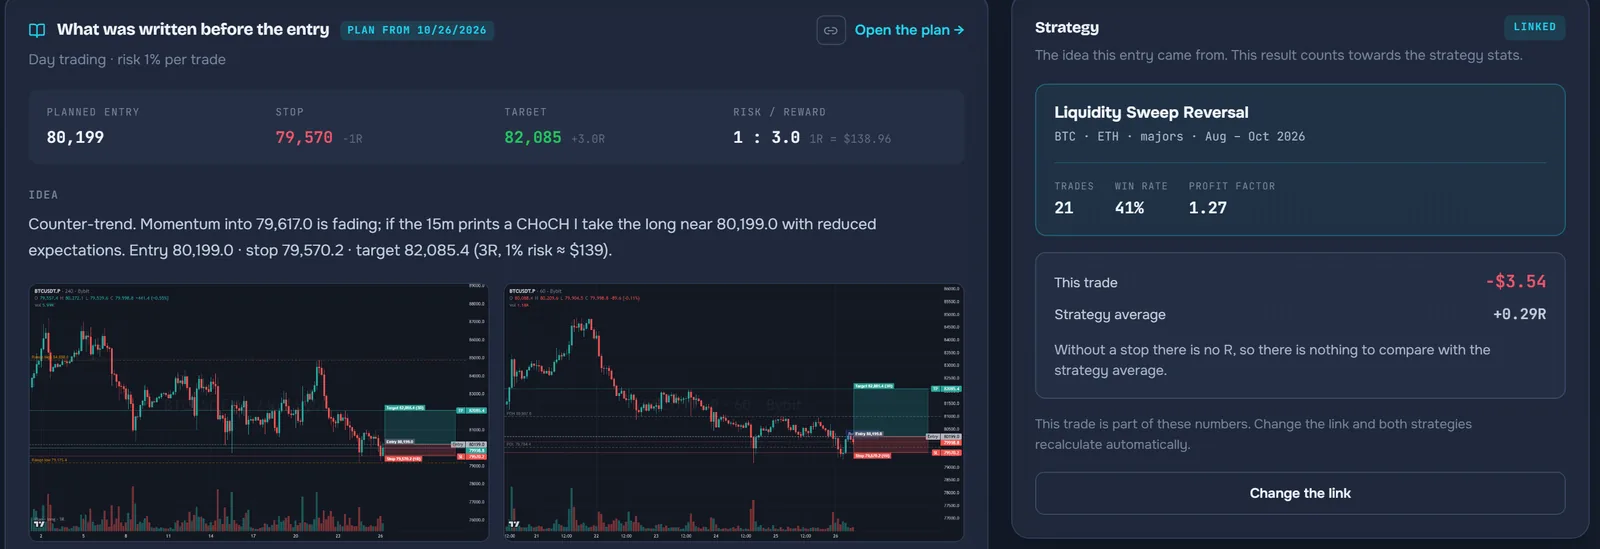
Plan card next to a trade: planned entry, stop, target and risk/reward, the idea text and the linked strategy with its win rate

The plan next to the execution

On the trade page the plan sits next to the fill: planned entry against the real one, stop and target, the idea written before the entry, and the strategy the setup belongs to with its own statistics.

  • Planned vs real entry, stop and target
  • Strategy stats for this setup
  • Chart screenshots per timeframe
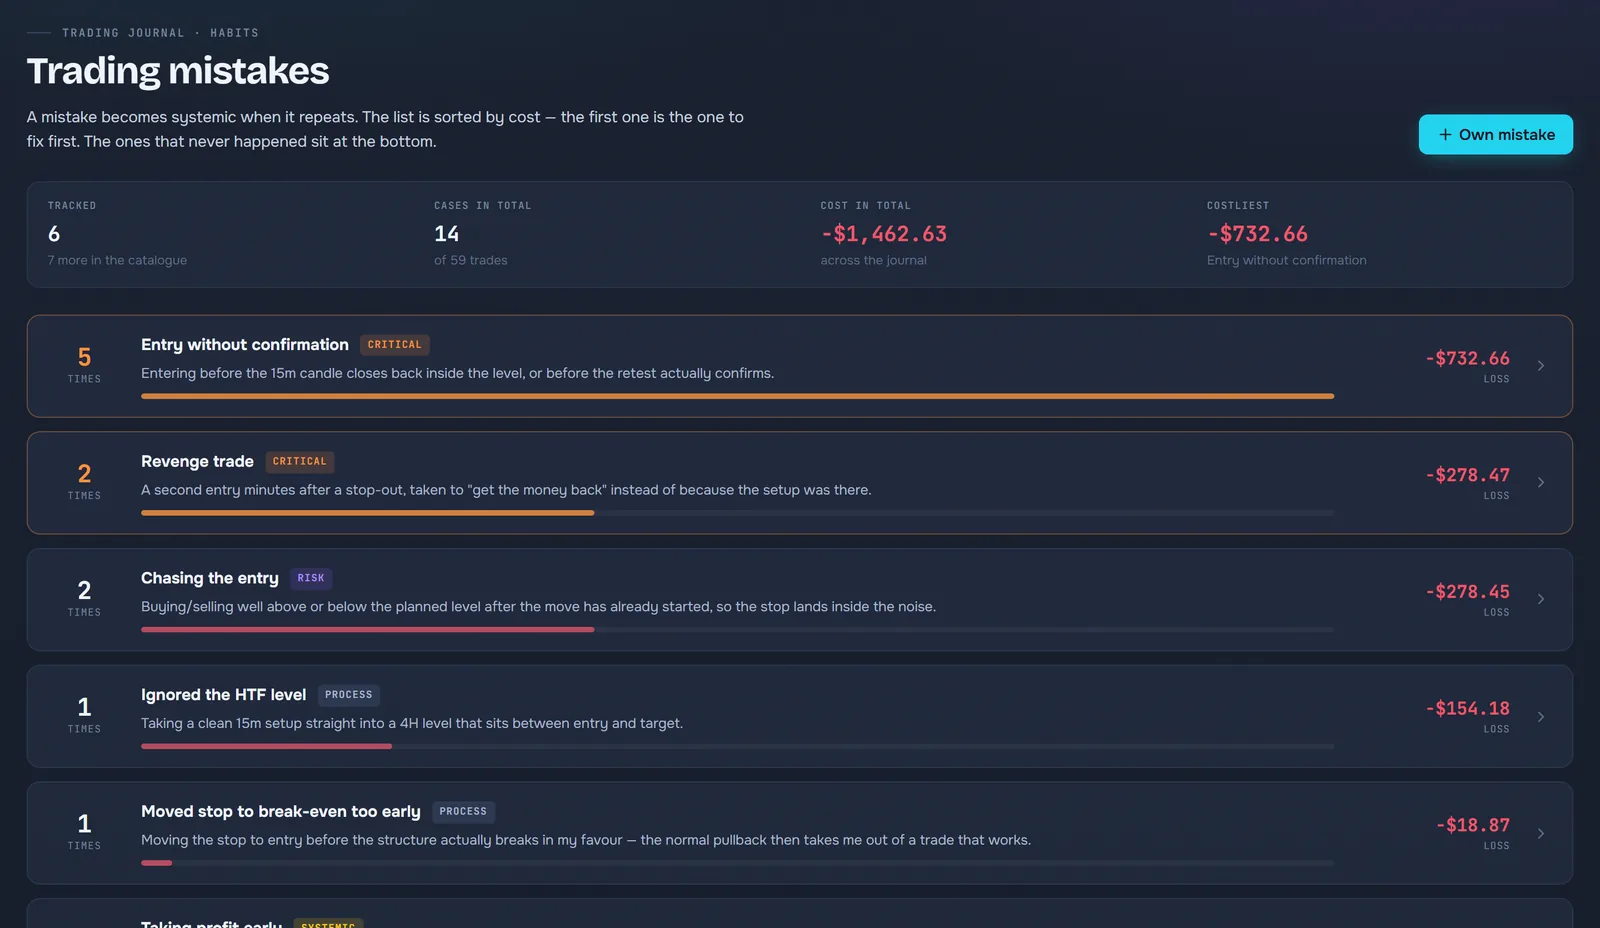
Trading mistakes page: six tracked mistakes sorted by cost, each with its count and total loss

Mistakes with a price tag

Tag a mistake on the trade and the journal counts what it costs: how many times it repeats and how much it took. The list is sorted by cost, so the first line is the habit to fix first.

  • A catalogue of typical mistakes plus your own
  • Cost in money and in repetitions
  • Critical, risk and process categories
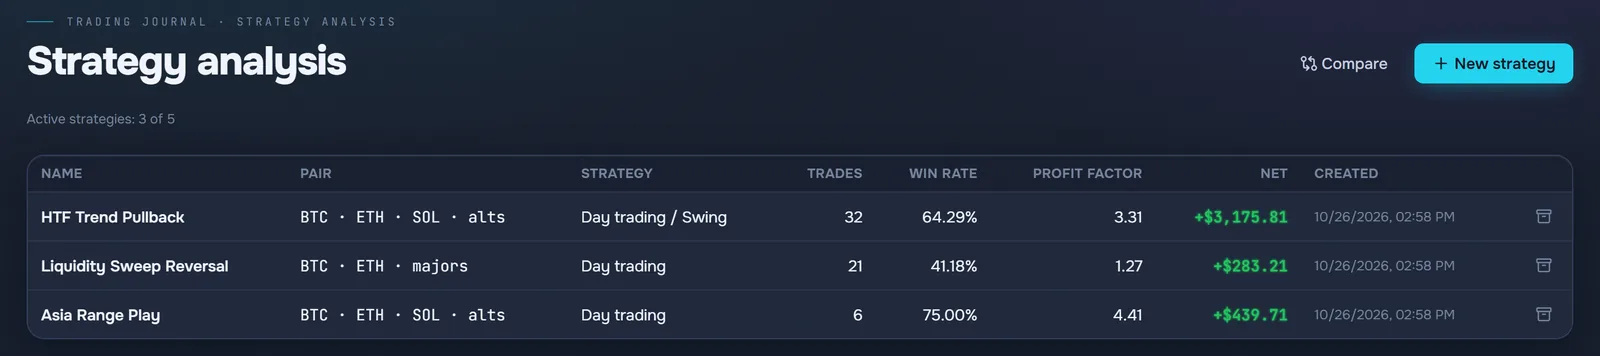
Strategy analysis table: three strategies with trades, win rate, profit factor and net result

Strategy analysis

Link each trade to a strategy and compare them side by side: trades, win rate, profit factor and net result per setup — on your live trades.

  • Win rate and profit factor per strategy
  • Compare strategies side by side
  • A trade’s result counts towards its strategy
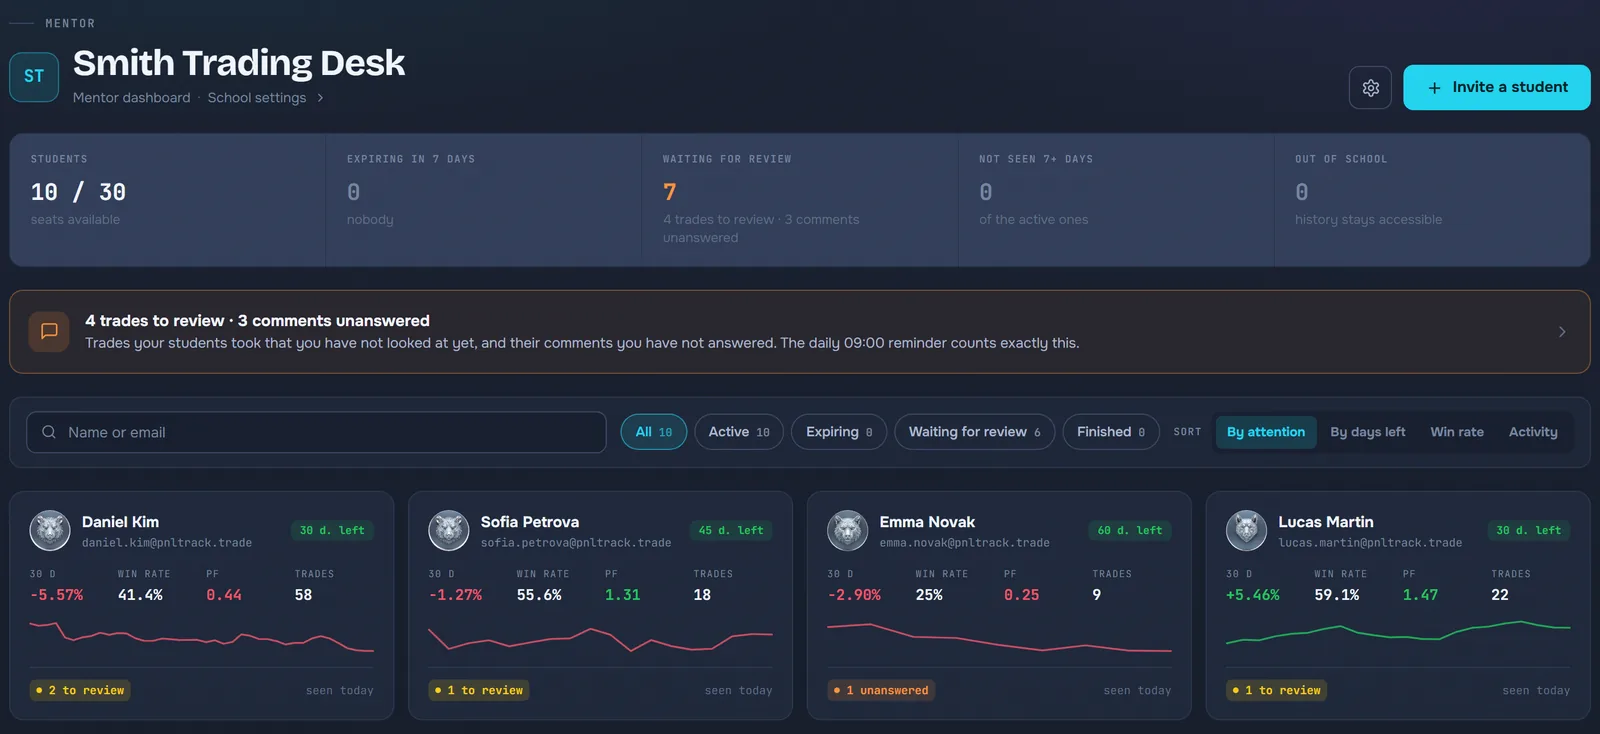
Mentor cabinet of a demo school: 10 of 30 student seats in use, a queue of 4 trades to review and 3 unanswered comments, and student cards with the 30-day result in %, win rate, profit factor and trades

Mentor cabinet: every student on one screen

Invite students and follow each of them on a card: the 30-day result in %, win rate, profit factor, number of trades and the result curve. The queue at the top collects the trades you have not reviewed yet and the student questions waiting for your answer.

  • Up to 30 students on the MENTOR plan
  • Trades to review and unanswered comments
  • Results in %, never in dollars
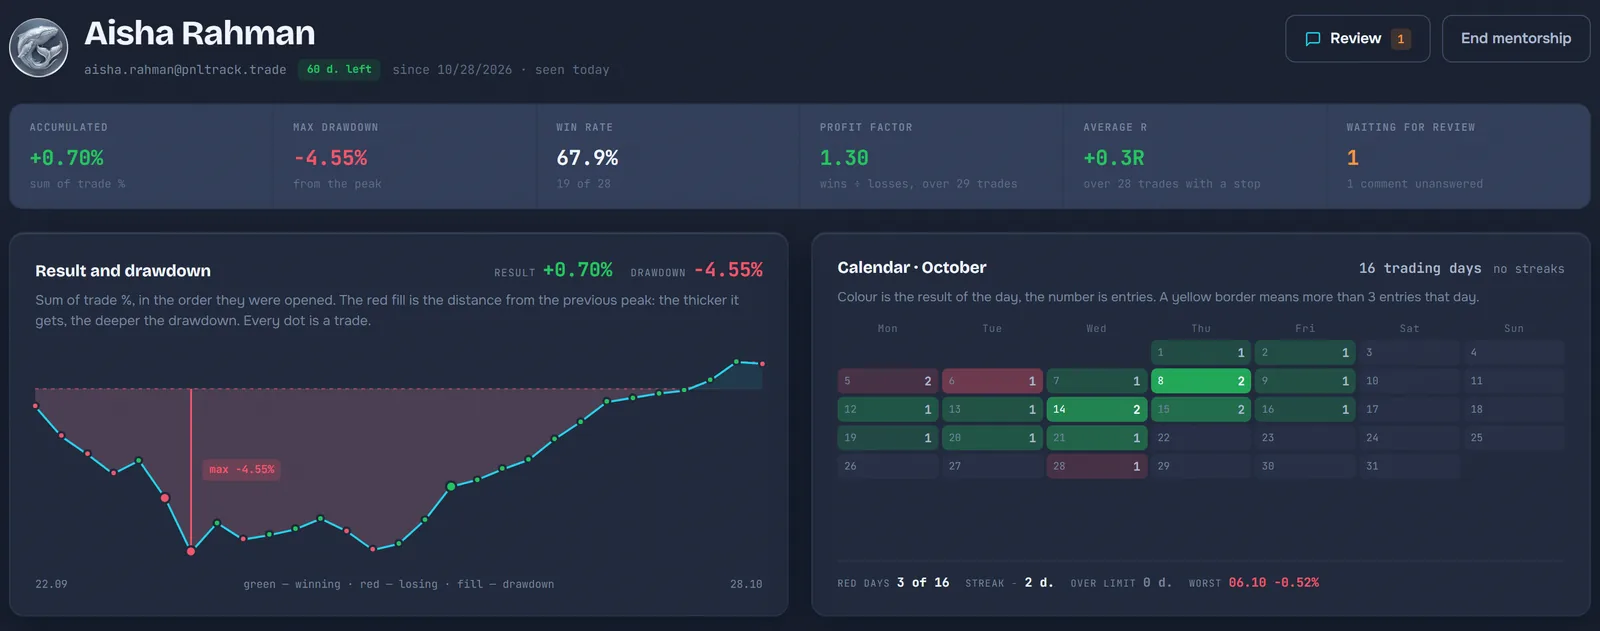
Student page in the mentor cabinet: accumulated result +0.70%, max drawdown −4.55%, win rate 67.9%, profit factor 1.30, average +0.3R, the drawdown curve and the October calendar

Each student’s trading in % and R

Open a student and the whole picture is there: the result curve with its drawdown, the calendar of trading days, win rate, profit factor and the average R of trades with a stop. The balance and the dollar amounts stay private: the server does not send them to the mentor at all.

  • Result and drawdown in %
  • Average R over trades with a stop
  • Calendar of the student’s trading days
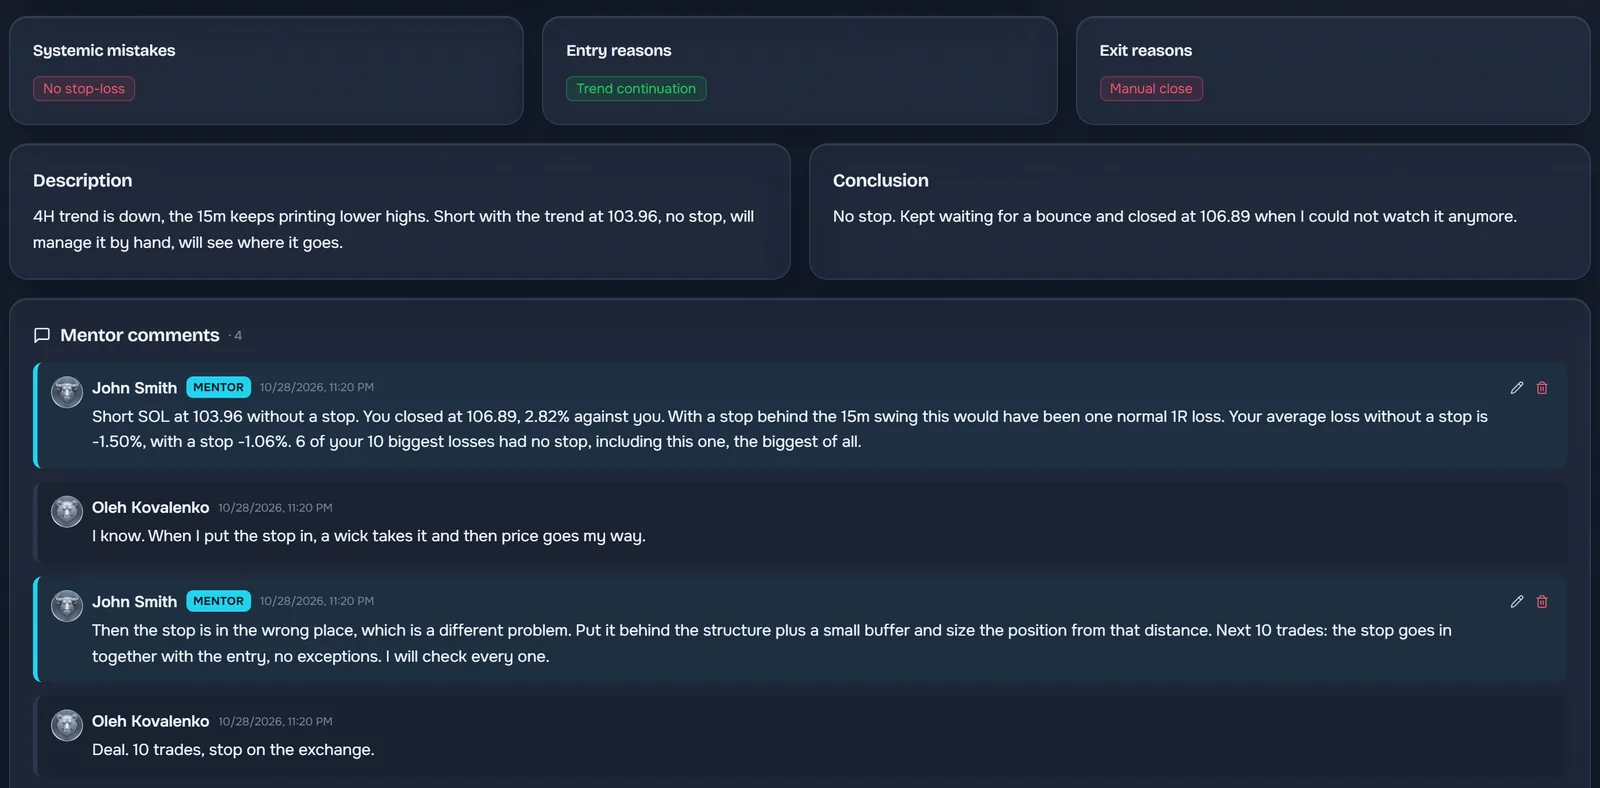
Trade review: a SOLUSDT short tagged “No stop-loss”, the student’s description and conclusion, and a four-message thread between the mentor and the student

Feedback right on the trade

The mentor writes under the trade itself, next to the student’s own description, conclusion and the mistake they tagged: where the stop belonged and what to change. The student answers in the same thread, so the whole conversation stays with the trade it is about.

  • A comment thread on every trade
  • The student replies in the same thread
  • Notes and mistake tags next to the feedback
Pricing

Simple, honest pricing

FREE

$0/ forever
 
Start for free
  • 1 exchange connection
  • 1 month of trading history
  • Unlimited trades
  • 1 active strategy
  • Basic AI trading hints
RecommendedSave 30%

TRADER

$4.92/ mo
$59 one-off, covers 12 months
Get TRADER
  • Up to 10 exchange connections
  • 3 years of trading history
  • Strategy analysis: 5 active, unlimited linked trades
  • Compare 2 strategies side by side
  • News calendar
  • AI trading hints
Save 30%

MENTOR

up to 30 students
$83.25/ mo
$999 one-off, covers 12 months
Become a mentor
  • Everything in TRADER
  • Mentor role: a dashboard of all students
  • Per-student discipline stats
  • Mentor comments on student trades
  • Group reports
  • Your school logo in the app

More than 30 students? Contact us

Are payments charged automatically?

No. Every payment is one-off — renewal happens only when you act.

What happens to my data after TRADER?

Your trades stay. History access narrows to 1 month and strategies to one active.

Can I upgrade to MENTOR?

Yes. The unused remainder of TRADER is credited towards MENTOR.

How to get TRADER for free

Register on exchanges via our referral links, trade — and get the full journal experience as a gift.

BYBIT
We accept
USDTTRC-20